Stock Market Analysis
In this post we used Python to analyze some indexes from the US Stock Market (Standard & Poors 500, Nasdaq and Dow Jones Industrial Average) and its corresponding ETF's [1] for their performance in Returns, Volatility and Risk in the period between January 1st of 2021 and September 16th of 2022. We also analyzed if one of the ETF (CSPX) correctly imitates the performance of its market.
Time series of normalized value (that is, the daily value divided by the initial value for the period for each index) and the yield of the period for all analyzed indexes:

The best overall performance for the period analyzed is for CSPX.L (one of the ETFs for the S&P 500) and the worst one is Nasdaq.
How is the daily return for the indexes analyzed? We calculated Mean, Volatility (the standard deviation) and the indicator Mean/Volatility to assess the risk of each one:
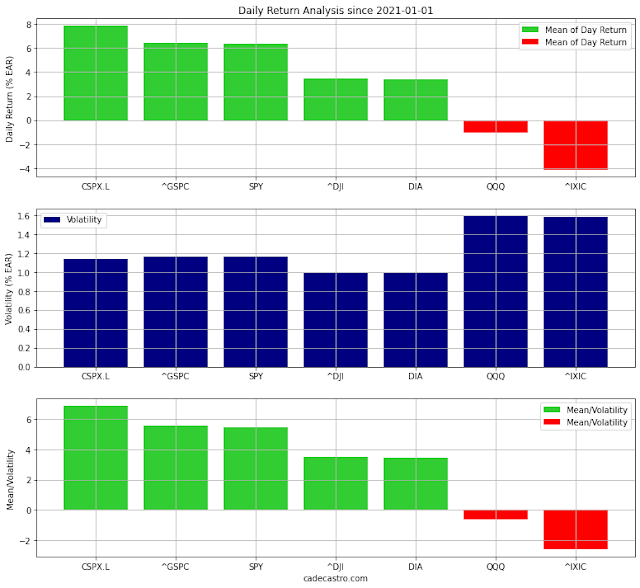
The best return average is for the indexes associated to the S&P 500 market, the worst for Nasdaq; Nasdaq and its ETF are also the most volatiles in this analysis indicating greater risk.
Time series for S&P 500 and the ETF CSPX, indicating in the plot the days when they got up or down in value and their corresponding 60 days rolling average:

CSPX appears to move as the S&P 500. Does the ETF correctly mirror the index as it is supposed? We plotted the two indexes and calculated the correlation:

The value R2 tells us that there is a strong correlation and the ETF performs as expected most of the time.
We expect to use these analyses to improve decision-making of investment of our part and our clients.
[1] What is an Exchange-Traded Fund (ETF)?
Data source: Yahoo Finance API. Web scrapping done using Python and Pandas library.


